Data Analytics vs Data Analysis: What’s The Difference?
Is Data analysis and data analytics are Two terms for the same concept or different having related terms?
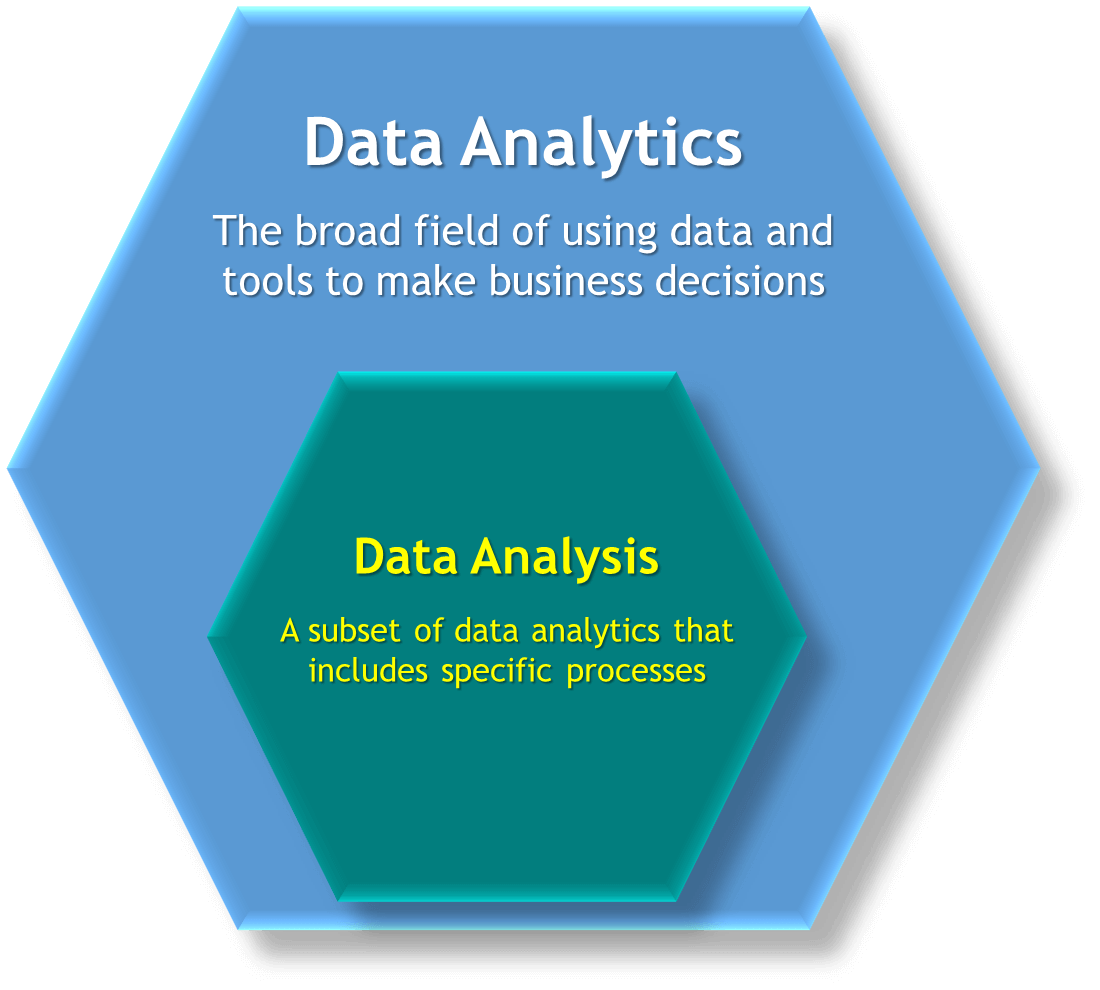
Normally, the common misunderstanding is that both data analysis and data analytics are the same, but the difference is:
- Data analytics is the broad field of using data and tools to make business decisions.
- Data analysis, a subset of data analytics, refers to specific actions.
To make more clear, let’s look at both terms with examples, and tools.
What is data analytics?
The term data analytics refers to the process of examining datasets to draw conclusions about the information they contain. Data analytic techniques enable you to take raw data and uncover patterns to extract valuable insights from it.
Data experts, including data scientists, engineers, and analysts to play around the data and make it easy for the rest of the business process and understand these insights.
Initially raw data does not reflect value, but to provides value, data analytics used both human- and machine-enabled steps to determine, interpret, visualize, analyze and provides data patterns in order to leverage business strategy and meaningful outcomes.
A data analytics experts provides a better strategy for the business to run. Data analytics can support on:
- Find historical trends
- Discover opportunities
- Predict actionable insights
- Business decisions
The approach of a data analytics is very organized and structured, consisting of many calculated and business process steps. The systematic approach guides data analytics to uses many different activities and work on different types and volumes of data sources.
In current data world, data analytics is majorly covered in data science, machine learning, and applied statistics. One of the main outcome of data analytics is to provide business reports including different data visualization that can tell the story of the most undiscovered points of the rest of the business.
The major highlight areas of data analytics leverage business opportunities are:
- to understand the actual facts and how to engage customers for the sales or marketing processes. A cloth seller might use its data to realize that its demand for woolen cloth increases in winter season, that means there is no need to give discount the prices during high demand.
- An increase mortality in pandemic might suggest to take proactive preventative measures.
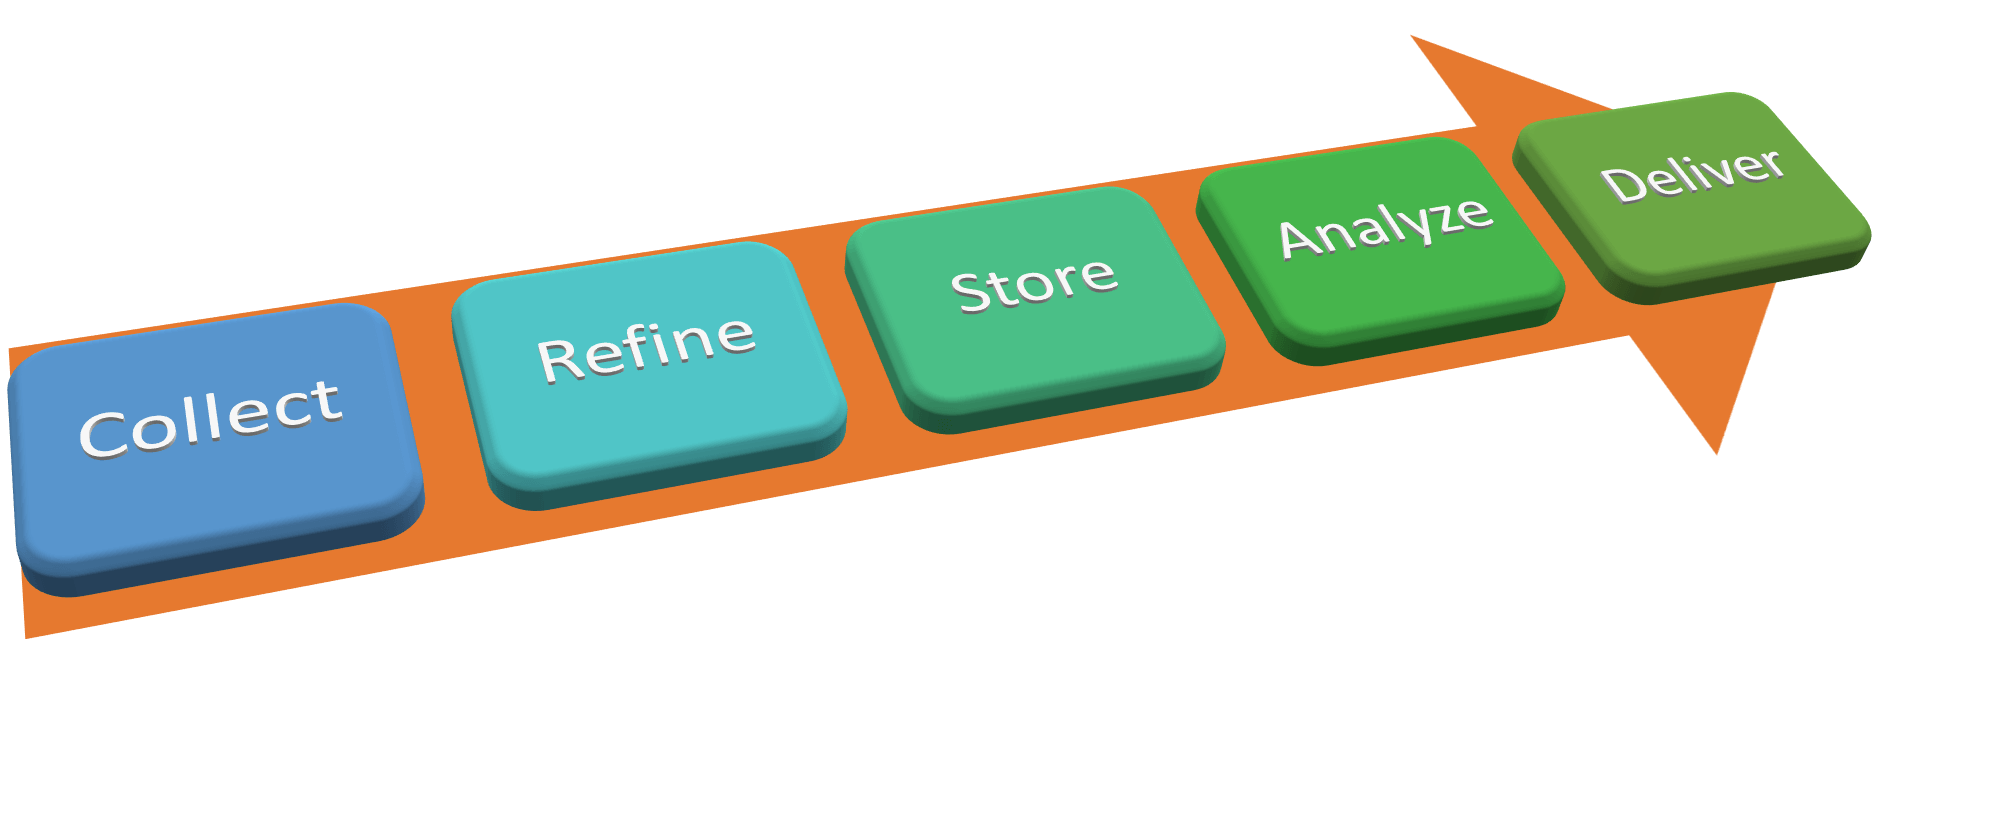
Data analytics processes:
The data analytics involves many different processes. The process flow are:
- Collecting and ingesting the data
- Categorizing the data
- Managing the data
- Storing the data
- Performing ETL
- Analyzing the data
- Sharing the data
What is data analysis?
Data analysis is the subset of the data analytics. Data analysis consists of
- Cleaning
- Transforming
- Modeling and
- Questioning data to find useful information in the form of visualization
During analyzing a dataset, it will come across other data analytics activities like:
- Providing others access to the data
- Visualizing the data
- Actionable discission based on the data
Type of data analysis
There are several types of Data Analysis techniques that exist based on business and technology. However, the major Data Analysis methods are:
- Text Analysis
- Statistical Analysis
- Diagnostic Analysis
- Predictive Analysis
- Prescriptive Analysis
Text Analysis
Text Analysis is also referred to as Data Mining. It is one of the methods of data analysis to discover a pattern in large data sets using databases or data mining tools. It used to transform raw data into business information. Business Intelligence tools are present in the market which is used to take strategic business decisions. Overall it offers a way to extract and examine data and deriving patterns and finally interpretation of the data.
Statistical Analysis
Statistical Analysis shows "What happen?" by using past data in the form of dashboards. Statistical Analysis includes collection, Analysis, interpretation, presentation, and modeling of data. It analyses a set of data or a sample of data. There are two categories of this type of Analysis - Descriptive Analysis and Inferential Analysis.
Descriptive Analysis
analyses complete data or a sample of summarized numerical data. It shows mean and deviation for continuous data whereas percentage and frequency for categorical data.
Inferential Analysis
analyses sample from complete data. In this type of Analysis, you can find different conclusions from the same data by selecting different samples.
Diagnostic Analysis
Diagnostic Analysis shows "Why did it happen?" by finding the cause from the insight found in Statistical Analysis. This Analysis is useful to identify behavior patterns of data. If a new problem arrives in your business process, then you can look into this Analysis to find similar patterns of that problem. And it may have chances to use similar prescriptions for the new problems.
Predictive Analysis
Predictive Analysis shows "what is likely to happen" by using previous data. The simplest data analysis example is like if last year I bought two dresses based on my savings and if this year my salary is increasing double then I can buy four dresses. But of course it's not easy like this because you have to think about other circumstances like chances of prices of clothes is increased this year or maybe instead of dresses you want to buy a new bike, or you need to buy a house!
So here, this Analysis makes predictions about future outcomes based on current or past data. Forecasting is just an estimate. Its accuracy is based on how much detailed information you have and how much you dig in it.
Prescriptive Analysis
Prescriptive Analysis combines the insight from all previous Analysis to determine which action to take in a current problem or decision. Most data-driven companies are utilizing Prescriptive Analysis because predictive and descriptive Analysis are not enough to improve data performance. Based on current situations and problems, they analyze the data and make decisions.
Combine these different methods depending on the business need and decision-making process as these analysis determine how to optimize the process to:
- Improve sales opportunities
- Reduce sales lead time
- Increase reven
Analysis that is repeatable can often be converted into a new metric within the analytic platform.
Which is better?
The outcome of data analytics is more encompassing and beneficial than the output of data analysis alone.
Consider the differences between:
- An analyst sending a business user a spreadsheet of numbers versus creating a dashboard for the user to interact with descriptive analytics.
- A business user receiving a report with the live value of a marketing campaign versus creating a web app that both shows the forecast and lets the user interact with predictive analytics.
The ultimate move is creating a product that makes a data-driven prediction and contacts another system’s API is order to produce action—that’s data analytics in action.
Tools for data analytics
Analytics software are tools that help humans and machines perform the analysis that allows us to make mission-critical business decisions.
Common tools for performing data analysis and overall analytics include:
- Microsoft Excel
- Microsoft Power BI
- Tableau
- R analytics
- Python
- Google Analytics
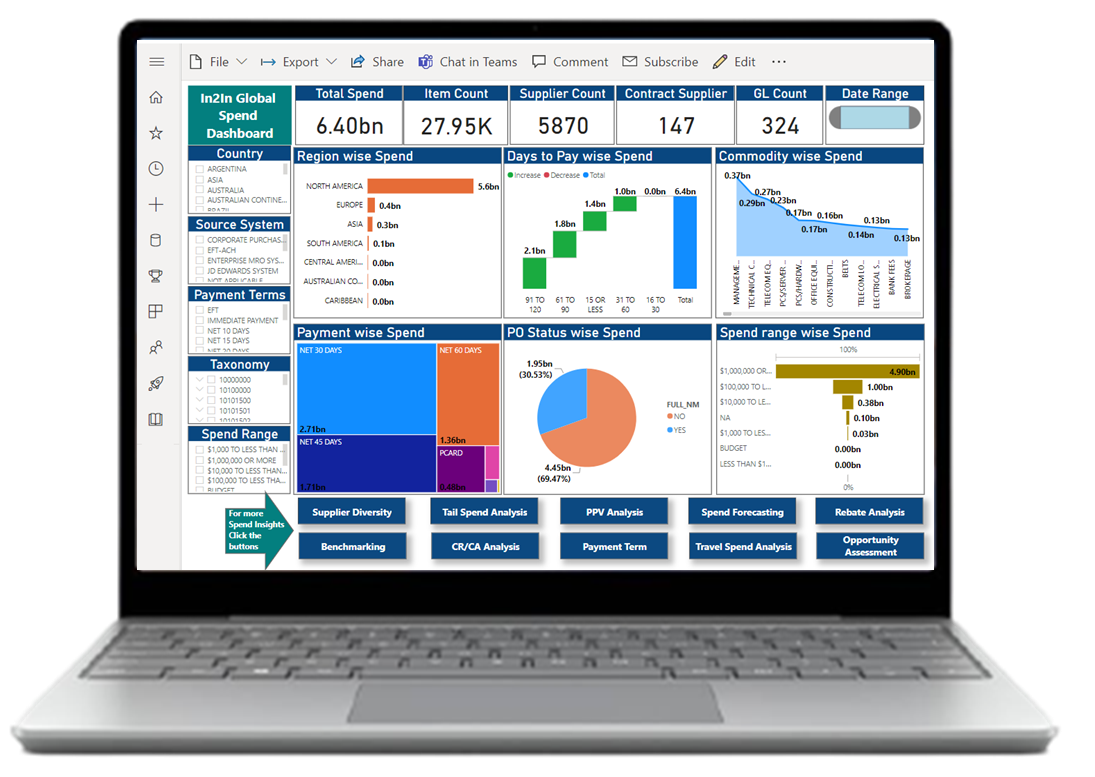
(Check out in2in global data analytic solution for data visualization tools.)
Conclusion
Data analysis is a process of studying, refining, transforming, and training of the past data to gain useful information, suggest conclusions and make decisions. Data analytics is using data, machine learning tools, statistical analysis, and computer-based patterns to gain better insight and design better strategies. It is the process of re-modelling past data into actions through analysis and insights to help in organizational decision making and problem-solving.
Our approaches:
If you’d like to know more about in2in global automated data analytics solution that can show meaningful and actionable analysis from your data and make it usable for its intended purposes, please get in touch with us!