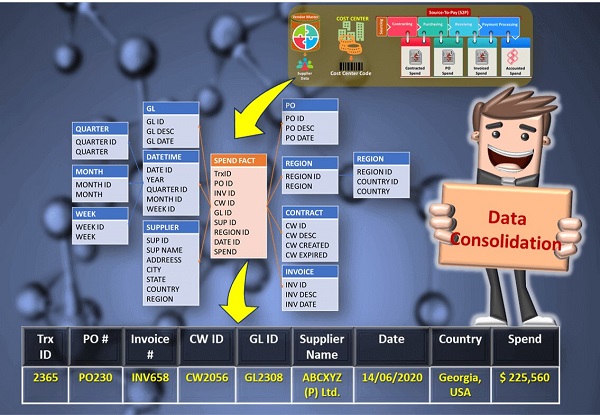
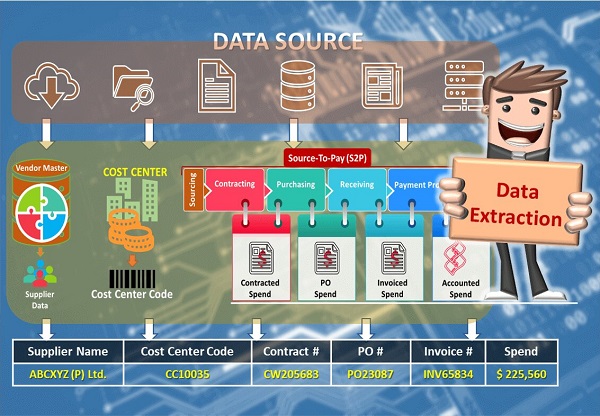
Solutions

Information is the oil of the 21st century, and analytics is the combustion engine. - Peter Sondergaard. Senior vice president , Gartner

Spend Data Extraction Services

Data Extraction

Data analysis starts with a company's raw transactional and operational data. Data Sources are single or many data storage locations like Cloud, ERP, Datawarehouse, flat files, etc. Collecting and extracting data is the initial stage in an ETL process (extract, transform, and load). The goal of ETL is to prepare data for analysis or business intelligence (BI). There are 2 types of data extraction methods:

  • Logical Extraction:. It is the first step in creating a physical data extraction plan. 
    • Full Extraction : Data copied from the source system in its entirety, even if untimestamped.
    • Incremental Extraction : This method extracts data in increments. Timestamps can monitor new or changed data.
  • Physical Extraction Extract data from the source system logically or physically.
    • Online Extraction : The staging area processes data directly from the source system.
    • Offline Extraction : In lieu of directly extracting data from the source, it is obtained from an external location (flat files, or some dump files in a specified format).

Data analysis starts with a company's raw transactional and operational data. Data Sources are single or many data storage locations like Cloud, ERP, Datawarehouse, flat files, etc. Collecting and extracting data is the initial stage in an ETL process (extract, transform, and load). The goal of ETL is to prepare data for analysis or business intelligence (BI). There are 2 types of data extraction methods:

  • Logical Extraction:. It is the first step in creating a physical data extraction plan. 
    • Full Extraction : Data copied from the source system in its entirety, even if untimestamped.
    • Incremental Extraction : This method extracts data in increments. Timestamps can monitor new or changed data.
  • Physical Extraction Extract data from the source system logically or physically.
    • Online Extraction : The staging area processes data directly from the source system.
    • Offline Extraction : In lieu of directly extracting data from the source, it is obtained from an external location (flat files, or some dump files in a specified format).

In a data warehouse, designing and developing an extraction process is a critical and time-consuming operation. A logical integration flow or physical process is created, and private data is secured. Because data extraction is the first stage in data analysis, it involves business executives, competent data specialists, and a good data extraction ETL tool or automated programming script.

Spend Data Consolidation Services

Data Consolidation

After operational data is created and gathered from various sources and formats, it must be combined, cleaned, and checked for faults before being stored in a data warehouse or data lake. Business executives prefer “Hand coding” by data engineers for small datasets from few sources or “ETL Tools” for huge datasets from many sources. In both cases, data tables from different sources are connected by a schema, which helps standardise and address meta data problems of data consolidation like:

  • data may not have all the required columns.
  • data has more columns than required
  • data types of columns may not match across datasets.
  • columns may not be in the same order across datasets.
  • data rows to be removed as its not relevant to the data analysis.

Even data consolidation is a lengthy, time-consuming task with resources like limited, data spread across multiple locations, and challenges like security issues; however, the simple, straightforward, and ready-to-use approaches outlined here will assist the process, saving costs and improving the efficiency of business decisions.

Taxonomy Consultancy Services

Taxonomy Consultancy

Transformed data should be classified into purchased goods/products or business services for better insights. Organizations also have general ledger (GL) codes that finance uses but aren't always the greatest fit for procurement. As a result, spend taxonomy is a hierarchical structure document that aids in the logical categorization of comparable spending items or services.

  • Taxonomy can be universal & standard like UNSPSC, SIC or NAICS or Customized taxonomy built by procurement and sourcing teams according to their expenses.
  • The hierarchy ranges from 3 to 5 levels of categories (generally used 4 Level), from general to specific
    • Level 1 (Group), Level 2 (Family), Level 3(Category) & Level 4 (Commodity)
    • E.g., Professional Services (L1) ← Marketing Services (L2) ← Advertising (L3) ← Radio & TV
  • Standard taxonomies are a wonderful place to start, but large organisations prefer custom taxonomies since they know their business domain and products/services.

Transformed data should be classified into purchased goods/products or business services for better insights. Organizations also have general ledger (GL) codes that finance uses but aren't always the greatest fit for procurement. As a result, spend taxonomy is a hierarchical structure document that aids in the logical categorization of comparable spending items or services.

  • Taxonomy can be universal & standard like UNSPSC, SIC or NAICS or Customized taxonomy built by procurement and sourcing teams according to their expenses.
  • The hierarchy ranges from 3 to 5 levels of categories (generally used 4 Level), from general to specific
    • Level 1 (Group), Level 2 (Family), Level 3(Category) & Level 4 (Commodity)
    • E.g., Professional Services (L1) ← Marketing Services (L2) ← Advertising (L3) ← Radio & TV
  • Standard taxonomies are a wonderful place to start, but large organisations prefer custom taxonomies since they know their business domain and products/services.

The problems in categorization are (1) too much spend will be categorised into generic categories if not enough levels (2) duplicate categories like Business Services IT Consulting & IT Business Services Consulting (3) too many “Other Spend” or “Miscellaneous Spend” categories make it difficult to understand what & where spend is occurring. However, taxonomy aids in improved category administration, expenditure visibility, negotiation, saving potential, and business growth.

Data Enrichment Improvement Services

Enrichment Improvement

Data enrichment helps decision makers clean, standardise, and classify data. To succeed, many consulting support centres use automation. Due to varied data problems, automated enriched data output only 50%-60% accuracy with quality, which is insufficient for improved data insight to be effective. Factors involve to improve better data enrichment are:

  • Manual Review : Experts examined enriched output data and recommended improvements.
  • Feedbacks Integration : Customer enrichment feedback to tag on specific dataset
  • Quality Analysis : To identify and fix enrichment output and wrong classification
  • Improved mapping logics : Based on quality analysis, business logic may be improved.
  • Granular level of customer data : As detailed level data gives the most accurate and actionable insights
  • Customer’s past golden records : Applied prior enhanced records to future comparable datasets
  • Geographic Data reference : Address, zipcode, phone no., emailid of supplier data for quality grouping
  • Market Intelligence : Market research report from third party boost enrichment quality

Data enrichment provides value-added information for improved business analytics and decision-making. It is not something an organisation does once and forgets about since data may be changed or added. In today's data-driven world, a successful data enrichment process is essential. To execute a data enrichment plan, corporate executives should focus on improving the process.

Tail spend analysis,Pareto Analysis,80-20 Analysis,Maverick spend Analysis

Tail Spend Analysis

Large businesses handle significant purchases (about 80% of overall spend) through carefully negotiated, secure, and long-term contracts. In the other 20% of purchases, big volume low value transactions are too fragmented to warrant dedicating resources to handle. These are called tail-end, long-tail, or low-value spend. Off-contract expenditure, tactical/spot buys, fragmented spend, commercial cards, expense reimbursement, non-po invoicing, one-time vendor spend, unclassified/misclassified spend, and maverick spend are all covered. It have :

  • Hidden Tail: Spend with big suppliers not covered by contracts or non-compliant spend.
  • Head of the Tail: Purchases from few suppliers and spend is not strategically managed (e.g., annually around $200,000 to $500,000 per supplier)
  • Middle of the Tail: Purchases from many suppliers and not strategically managed (e.g., annually around $2,000 to $200,000 per supplier)
  • Tail of the Tail: Purchases from many suppliers, spend is highly fragmented and transactional & includes many one-off purchases (e.g., annually less than $2,000 per supplier)

The absence of data visibility is the most challenging to manage. This happens for a variety of reasons, including different systems for procurement and contract administration, and silos within an organisation utilising the same vendors. The largest cost and time reductions might come from a large number of modest transactions if managed effectively as actionable insights. As a result, efficient tail expenditure analysis improves (1) visibility and control of total spend, (2) contract compliance and reduces risk, (3) future expenses and minimises spend creep, (4) Identify cost saving opportunities, (5) efficiency and productivity and (6) customer satisfaction.

Opportunity Assessment,Saving Opportunity

Saving Opportunity

Most businesses know what they purchase, how much they pay, who they pay, and what fair price is. This knowledge allows for effective direct category management, cost reductions, and supplier performance. It does not apply to these important categories since they only account for a tiny percentage of the organization's overall spend and so provide a limited fraction of the cost reduction prospects. So, most cost reduction possibilities are concealed in the rest of the organization's purchases. Because these categories are less visible, they have historically been undermanaged, purchased from too many vendors, and purchased over benchmark costs. To identifying these hidden saving opportunities, organizational leader keen to know below analysis:

  • Indirect / Maverick Spend
  • Cost Reduction
  • Cost Avoidance
  • Rebate Analysis
  • Benchmarking
  • Supplier Consolidation

Most businesses know what they purchase, how much they pay, who they pay, and what fair market value is. This knowledge allows for effective direct category management, cost reductions, and supplier performance. It does not apply to these important categories since they only account for a tiny percentage of the organization's overall spend and so provide a limited fraction of the cost reduction prospects. So, most cost reduction possibilities are concealed in the rest of the organization's purchases. Because these categories are less visible, they have historically been undermanaged, purchased from too many vendors, and purchased over benchmark costs. To identifying these hidden saving opportunities, organizational leader keen to know below analysis:

  • Indirect / Maverick Spend
  • Cost Reduction
  • Cost Avoidance
  • Rebate Analysis
  • Benchmarking
  • Supplier Consolidation

Saving time and money enhances an organization's productivity and standards. Also, it may be used to expand the company and create additional jobs and general industrial success.

Indirect Spend Analysis

Indirect Spend Analysis

Direct Spend is money spent on services, commodities, and materials that generate profit, performance, and competitiveness. Indirect Spend is spent on maintenance, commodities, and services that do not immediately contribute to a company's bottom line. It comprises everything other than the items your firm sells to its consumers and can range from 25% to 40% of total cost. Due to the fact that indirect expenditure categories do not contribute to corporate growth, they should be managed effectively to save money. Indirect categories are :

  • Travel expenses, Office furniture, Maintenance costs
  • Computers and office hardware (printers, phones, etc)
  • Utilities (gas, electric, water)
  • Workplace and facilities management (toilet paper, cleaning supplies)
  • Employee management and development costs (training sessions, human resources costs)
  • Consultants and professional services (speakers, advisers, coaches etc)
  • Advertising and marketing expenditure (advertising, public relations etc).

Modern procurement procedures use digital technology to solve challenges such as lack of transparency, uneven compliance with internal rules, and inadequate data management. By learning about these tools and creating a formal plan for indirect procurement and spend management, businesses may increase profitability, performance, and save money.

Give us an opportunity to serve you better

Let's talk about your data transformation and insights issues. Our highly skilled data analysts will look at your data challenges and offer cost-effective price plans on both automated platform & consulting approach. We'll show you how our solutions mitigate risk, guarantee compliance and optimize revenues from your transactional data.