Process

If you can’t describe what you are doing as a process, you don’t know what you’re doing. - Dr. William Edwards Deming. Statistician and management consultant

1Step
User Registration
Signin
Signup
2Step
Create Project
Create a new project
Download Template
Upload Template with
Transaction Data
3Step
Pre-Enrichment
Insight
Data Profiling
Pre-Enrichment
Dashboard
4Step
Data Enrichment
Data Cleansing
Supplier Clustering
Data Classification
5Step
Post-Enrichment
Insight
Post-Enrichment Dashboard
Download Enriched
Output data
6Step
Actionable Insight
Advanced Data
Analytics
Opportunity
Assessment
TheProcess

Process - How it Works

Information to insight login

User Registration

  • New user can Register or Signup with the Username, existing EmailID & valid Password
  • Password is a combination of Letter, Number & Special character
  • Once Signup, user will receive a welcome mail on registered mailID & an Activate button to activate account
  • After activation of account, user Login or Signin using registered mailID and password
  • User can Signin using existing Facebook or Google account
  • Registered user can reset the password with registered mailID by using "Forgot Password"
Data classification process

Create Project

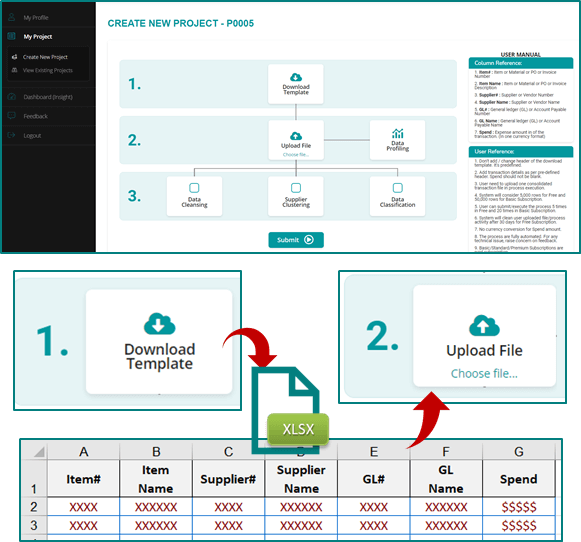
  • Users to select “Create New Project” from “My Project” section
  • System will assign a project number for that project
  • Users need to download pre-defined excel template by clicking “1. Download Template”
  • The download excel template is a blank excel file with pre-defined headers.
  • Users need to fill related rows or transactions as per the header and save it.
  • The “User Manual” mentioned on the right side will help about the columns & user reference.
  • Users need to click “2. Upload File” to select or choose the filled template and to upload the file into this project.
  • A message will be shown once the file got uploaded.
Data profiling insight

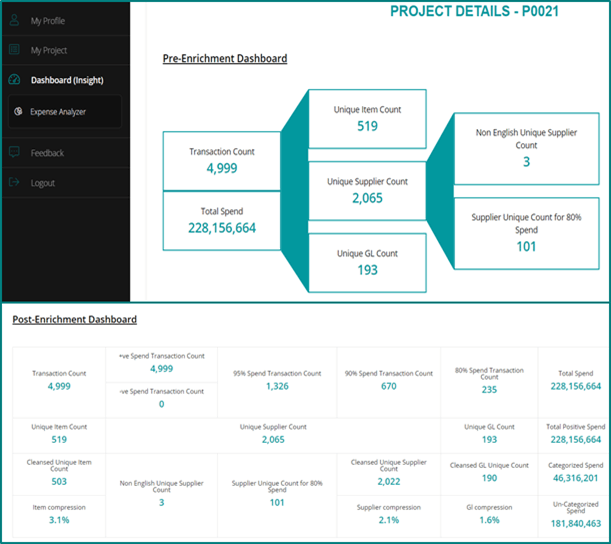
Pre-Enrichment Insight

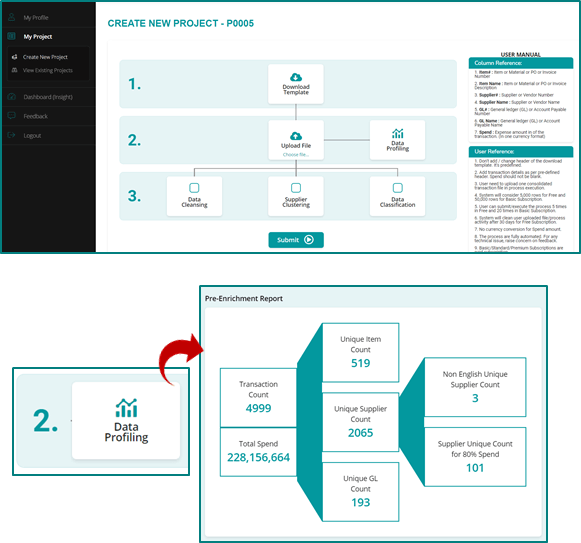
  • Once transaction file got uploaded, user can get the basic insight from the raw data
  • This is called “Pre-Enrichment Insight”
  • These insights are based on:
    • Total Transaction count
    • Sum of Spend Amount
    • Unique Transaction count on basis of item purchased
    • Unique Transaction count on basis of Supplier
      • Unique non-English Supplier count
      • Unique Supplier count contributing 80% of total spend
    • Unique Transaction count on basis of Account payable
  • This insight makes user to “go or don’t go” decision for effective actionable insight.
  • Also predicts if any additional manual processing is needed.
Enrichment,cleansing,normalization,classification

Data Enrichment

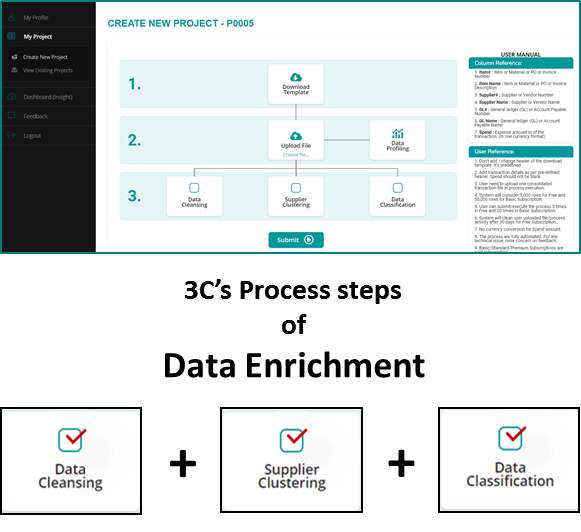
  • Transactional information needs to be enriched by 3 major steps (3C’s) that leads to effective actionable insights
  • The 3C’s or process steps of Data Enrichment to enrich information are:
  • Cleansing (Mandatory step):
    By removing or modifying incorrect, incomplete, irrelevant, duplicate, or improper format data for maximize data accuracy.
  • Clustering:
    By normalizing Supplier name with the help of data cleansing using business rules and/or legacy corporate hierarchy linking library.
  • Classification:
    By categorizing or classifying transactions for similar material/services and assigns into a taxonomy bucket or a category hierarchy.
  • User need to select the enrichment options and click “Submit” button to process the activity.
Enrichment,visualization,analytics

Post-Enrichment Insight

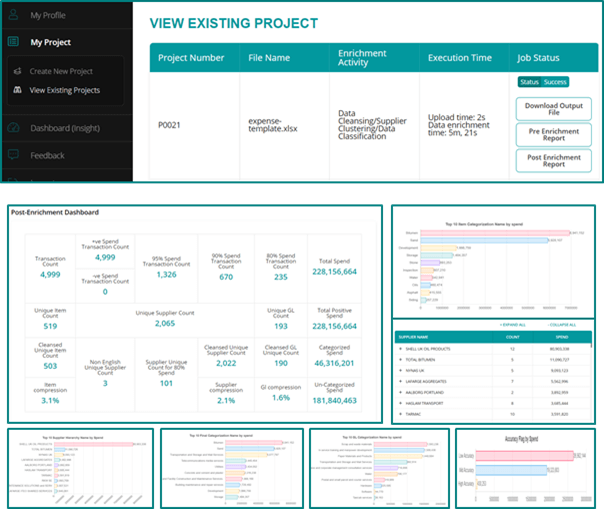
  • User can be able to find the enrich information from post-enrichment insights
  • Once the data enrichment activity completed, it will be available on “View existing project” of “My Project” section
  • Post-Enrichment insight is having a combination of calculations, graphs and parent-child level analytics.
  • Major insights like:
    • Transaction count on the basis of cleansing, clustering & classifications
    • Distribution of +ve and –ve spend amount
    • Attribute-wise top 10 ranked taxonomy analytics
    • Accuracy report
    • Supplier hierarchical spend distribution report
  • User can take more decisions looking at the analytics.
  • User can also download enriched information by clicking “Download Output File” button.
Data visualization actionable insight

Actionable Insight

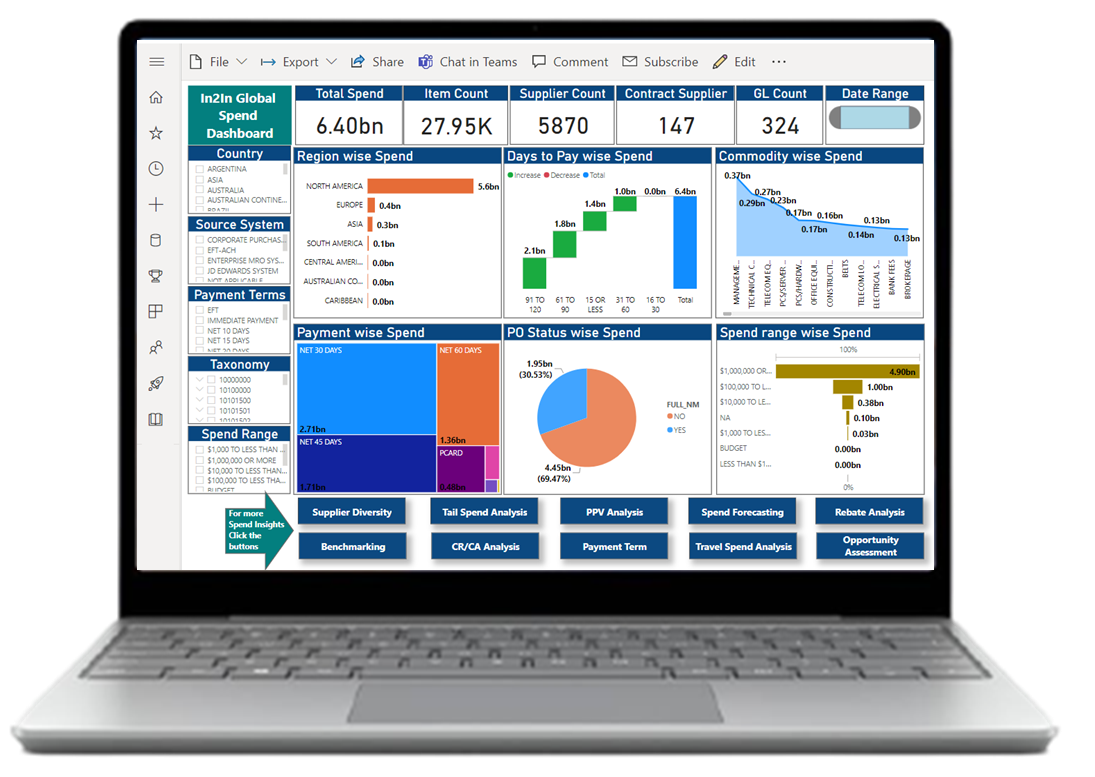
  • The pre and post-enrichment insights will guide user to take business decision or action on certain insights.
  • User can visualize both insights from “Expense Analyzer” from “Dashboard(Insight)” section.
  • Actionable insights are based on:
    • 1. Advance Analytics
      • Tail spends and Indirect Spend Analysis
      • Payment Term and Price Variance Analysis
      • Maverick purchase and Bottleneck commodities Analysis
    • 2. Opportunity Assessments
      • Historical Spend Trend Analysis
      • Spend Forecasting
      • Saving Opportunity

Give us an opportunity to serve you better

Let's talk about your data transformation and insights issues. Our highly skilled data analysts will look at your data challenges and offer cost-effective price plans on both automated platform & consulting approach. We'll show you how our solutions mitigate risk, guarantee compliance and optimize revenues from your transactional data.