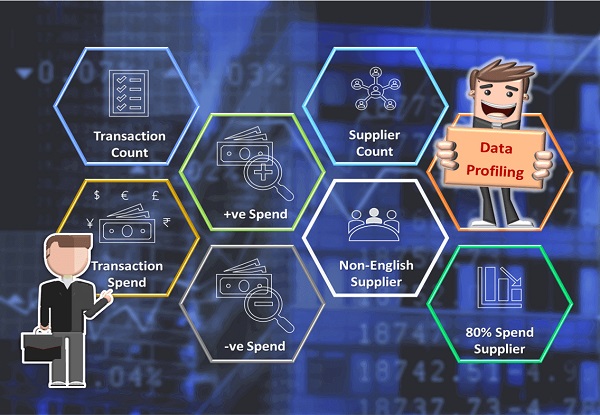
Services

The ability to take data – to be able to understand it, to process it, to extract value from it, to visualize it, to communicate it – is going to be a hugely important skill in the next decades. - Hal Varian. Chief Economist, Google

Data Profiling Services

Data Profiling

Before Data Transformation or Data Enrichment an organisation should assess the data's accuracy, completeness, and validity. In data quality evaluation, it measures three things: uniqueness, consistency, and logic. some of the key questions for efficient and effective data profiling are:

  • Is the dataset complete? Are there any null values or blank rows?
  • Is each record unique, or are there duplicates?
  • Are there patterns in the data that can anticipated?
  • What is the range of the data values? What about total negative value records?
  • Are the minimums, maximums, averages & total what was expected?

Before  Data Transformation or Data Enrichment, an organisation should assess the data's accuracy, completeness, and validity. In data quality evaluation, it measures three things: uniqueness, consistency, and logic. some of the key questions for efficient and effective data profiling are:

  • Is the dataset complete? Are there any null values or blank rows?
  • Is each record unique, or are there duplicates?
  • Are there patterns in the data that can anticipated?
  • What is the range of the data values? What about total negative value records?
  • Are the minimums, maximums, averages & total what was expected?

Data profiling is visualized using summaries & graphs. It improves data quality, understanding of data & reduces the execution time for other major data enrichment initiatives. One of the major advantages of data profiling is the discovery of market information found in the data itself.

Spend Data Cleansing Services

Data Cleansing

An organization's strategic decisions require actionable data analysis. It depends on clean data. The data is disorganised and scattered, making the analytical process less visible and exact. Data cleaning is the initial stage in data transformation, improving data quality and overall efficiency. Data cleansing based on :

  • Processing, defining, and correcting jumbled, unstructured data
  • Filling in missing values, finding and removing errors
  • Detecting, fixing and rectifying (or deleting) of irrelevant, inaccurate, corrupted, incorrectly formatted, duplicate, or incomplete data within a dataset

Data cleansing is the foundation of an organization for reliable, accurate, and successful data analysis. The actionable insight based on cleansed data helps to (1) Improves decision making process, (2) Streamline's business practices, (3) Boost productivity & revenue, (4) Save money & reduce waste, (5) Save time & increase productivity, (6) Minimize compliance risks etc.

Supplier Normalization Services

Supplier Clustering

Purchases from the same supplier with varied names, spellings, mis-spellings, and abbreviations are possible while collecting and integrating organisation transactional data e.g., same supplier spelled as “Federal Xpress” or “FedEx” and “Federal Express. A supplier's name may vary depending on geography, corporate entity, or subsidiary ike “IBM India Pvt Ltd”, “IBM Japan Ltd”, “Redhat”. Supplier clustering or Supplier Normalization is a technique used to maintain data consistency. The benefits are:

  • Helps customer groups based on the purchasing patterns
  • Helps to create reports, insights and then analyze the true consolidated spend.
  • Achieving the greatest volume of savings potential or saving opportunity.
  • Managing the number of suppliers for Pareto analysis.

Purchases from the same supplier with varied names, spellings, mis-spellings, and abbreviations are possible while collecting and integrating organisation transactional data e.g., same supplier spelled as “Federal Xpress” or “FedEx” and “Federal Express. A supplier's name may vary depending on geography, corporate entity, or subsidiary ike “IBM India Pvt Ltd”, “IBM Japan Ltd”, “Redhat”. Supplier clustering or Supplier Normalization is a technique used to maintain data consistency. The benefits are:

  • Helps customer groups based on the purchasing patterns
  • Helps to create reports, insights and then analyze the true consolidated spend.
  • Achieving the greatest volume of savings potential or saving opportunity.
  • Managing the number of suppliers for Pareto analysis.

Supplier clustering helps to manage suppliers for better negotiation and saving opportunity. It can be achieved by text base grouping on cleansed supplier name and by taking support from additional supplier attribute like location, EmailID, contact number etc. Also, a third party corporate Legal Linkage dataset helps to identify supplier hierarchies in organization’s supplier data.

Spend Data Classification Services

Data Classification

Businesses usually buy goods and services from many vendors. A company must know where and how much money is spent. Without a sensible classification system, understanding the expenditure is impossible. As a result, data classification or categorization assists the company by categorising data into distinct buckets of information with consolidated spend.

  • It is the process of bucketing cleansed and clustered data for similar goods or services, assigning them into a predefined taxonomy category
  • Taxonomy is document of categorical hierarchy of spend and sourcing groups, from general to granular.
  • By using taxonomy, procurement and sourcing teams truly understand their spending.
  • It helps procurement managers for spend visibility and saving opportunities.

UNSPSC, SIC, and NAICS are ideal starting points for data classification. To make it more valuable, organisations can create their own unique taxonomies based on their domain or company. Spend analysts use business logics or methods like Machine Learning, Rule base algorithms, and historical golden data mapping findings to properly categorise goods and services data.

Spend Data Analytics Services

Data Insights

Spend data insights are a consolidated view of an organization's spending that procurement managers may access after cleaning, clustering, and categorization methods on improved transactional data. It comes in the form of reports, dashboards, and data visualisations. having some of major KPI’s like :

  • Spend by category & sub-categories
  • Number of normalized suppliers by category
  • Top n supplier & category by spend
  • Fiscal year spend trends by category
  • Business Unit wise spend by category
  • Direct & indirect category spend report
  • Tail spend or Pareto analysis

Spend Cube is a three-dimensional OLAP data view for data insights. A spend cube presents expenditure data in three dimensions: suppliers, business units, and item or service categories. The three axes indicate category, business user or cost centre, and supplier (who are we buying it from). It lets you'slice and dice' data and see it from various angles. The spend cube data insights enable procurement managers (1) analyse categories, (2) manage suppliers effectively, (3) improve procedures, (4) track suppliers and spend, (5) identify preferred suppliers and (6) saving opportunities.

Actionable Insights Services

Actionable Insights

Having seen key expenditure data insights, procurement managers and business executives may now consider what actionable insights to request for. Rather than just answering a question, these ideas inspire action. Actionable insights force you to reassess the problem and seek a fresh solution. Some of the key attributes of actionable Insights are:

  • Able to influence decisions and drive the business efficiently with a meaningful outcome
  • Is a game changer for the customers
  • Helps to engage with more customers, build trust & boost sales
  • It ensure to deliver information to the right person or the key decision makers at the right time so that it will effectively actioned
  • As it is driving actions, it leads to results.

Opportunity assessment insights like (1) Potential Saving opportunity, (2) Spend forecasting, (3) Tail spend supplier analysis, (4) Payment term analysis, (5) Indirect spend Analysis, (6) Supplier Diversity Analysis, (7) Preferred Supplier Analysis, (8) Contract compliance analysis are the major actionable insights of a business leader to rethink & act for a meaningful outcome.

Give us an opportunity to serve you better

Let's talk about your data transformation and insights issues. Our highly skilled data analysts will look at your data challenges and offer cost-effective price plans on both automated platform & consulting approach. We'll show you how our solutions mitigate risk, guarantee compliance and optimize revenues from your transactional data.